In the age of social media, leveraging Facebook Ads, or Meta Ads, is indispensable for businesses aiming to target specific audiences effectively. Nevertheless, the real potency of a marketing campaign lies in the ability to dissect and understand ad performance data.
This is where the synergy between Facebook Ads and Google Sheets shines, allowing for a nuanced analysis of digital ad campaigns. However, transitioning ad data into Google Sheets has traditionally been a cumbersome process fraught with complications and inaccuracies.
Fortunately, with the advent of Uniquery, a Google Sheets add-on designed for marketing data importation, this process has become significantly streamlined.
In this post, I will go through how to begin importing Facebook Ads into Google Sheets using Uniquery, ensuring that your marketing analysis is as smooth and efficient as possible.
What is Uniquery?
Uniquery revolutionizes the way marketers handle data from Facebook Ads by providing a direct pipeline into Google Sheets.
This powerful Google Sheets add-on negates the need for manual data exports and dashboard reconstructions, making real-time data analysis not only possible but easily achievable.
With Uniquery, you can create Facebook Ads performance reports with one click with your desired metrics and data dimensions, and schedule your report data to be automatically refreshed every hour, day, or week.
Installing Uniquery
Uniquery is a Google Sheets addon. Here’s a straightforward process to get you started:
1. Open a New Spreadsheet: Launch Google Sheets and start with a fresh spreadsheet.
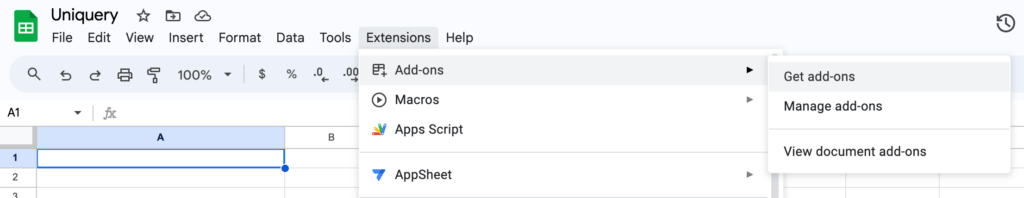
2. Navigate to Extensions: From the Google Sheets menu, select ‘Extensions’, then choose ‘Add-ons’ > ‘Get add-ons’.
3. Search in Google Workspace Marketplace: In the search bar, type “Uniquery” and select the first app that appears.
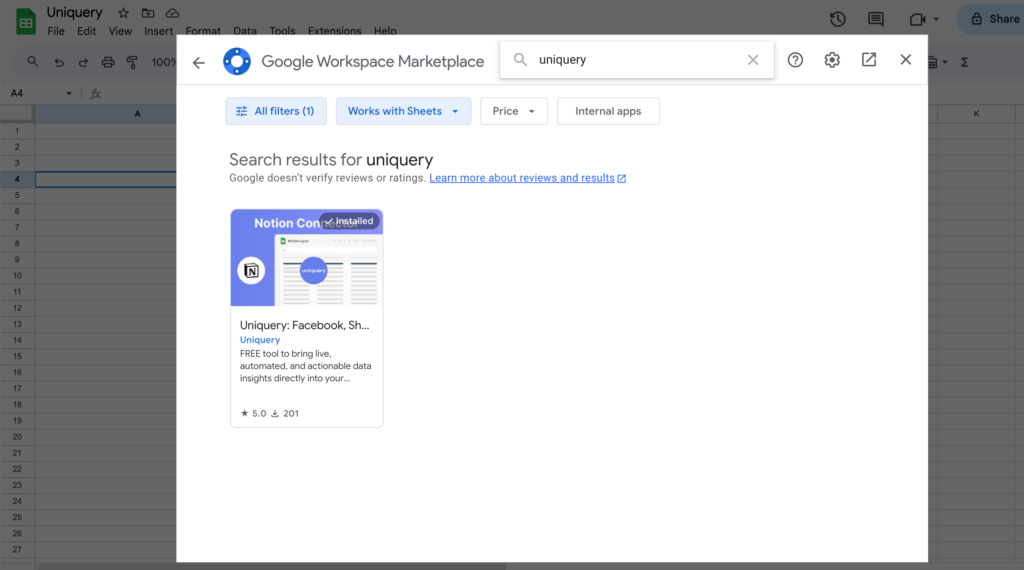
4. Install Uniquery: Follow the on-screen prompts to install the add-on.
5. Launch Uniquery: Post-installation, you can access Uniquery from the ‘Extensions’ tab, where it’s listed as an add-on.
Authorizing Uniquery for Facebook Ads Data Import
Before importing any data, you need to authorize Uniquery to access your Facebook Ads account:
- Open Uniquery Sidebar: In the sidebar of your spreadsheet, launch Uniquery.
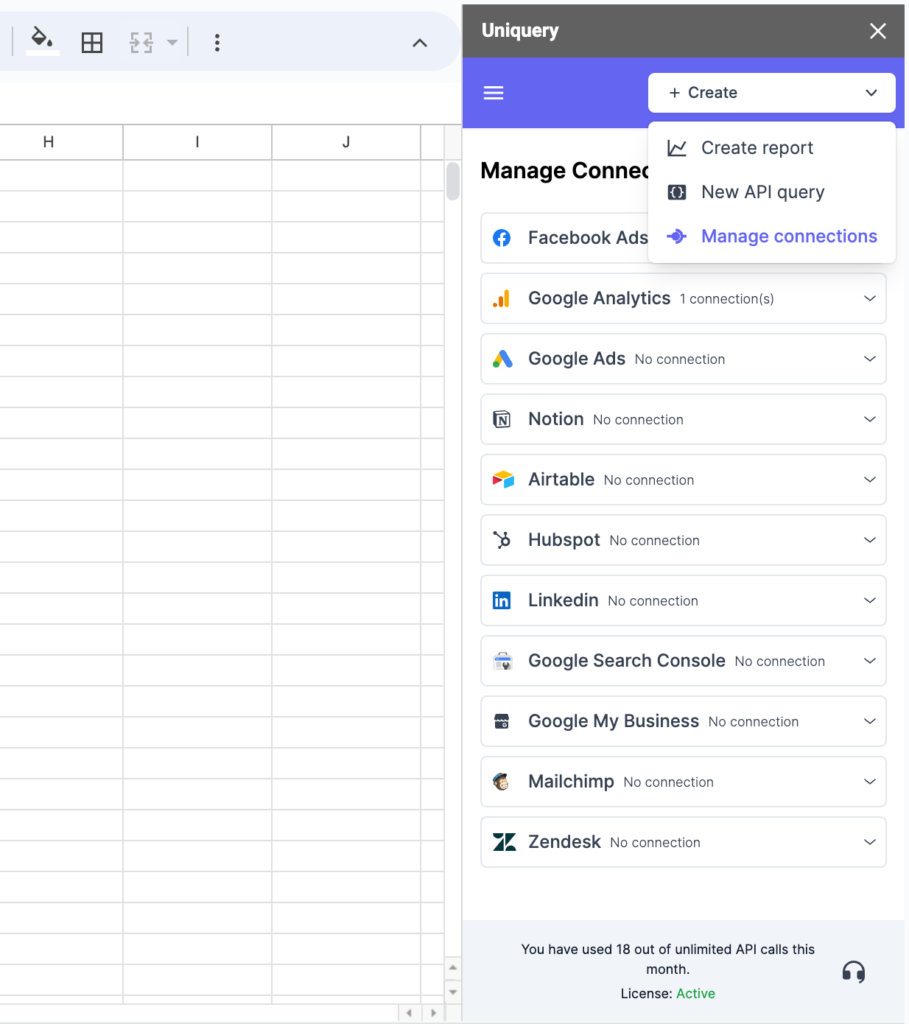
- Link Your Facebook Account: Navigate to Create > Manage Connections via the menu icon, click ‘Add Connection’, and select Facebook for linkage.
- Authorize Connection: Follow the prompts, log in to your Facebook account, and authorize Uniquery to access your ad data.
Importing Facebook Ads Data into Google Sheets
Now that Uniquery is set up and authorized, you’re ready to import Facebook Ads data:
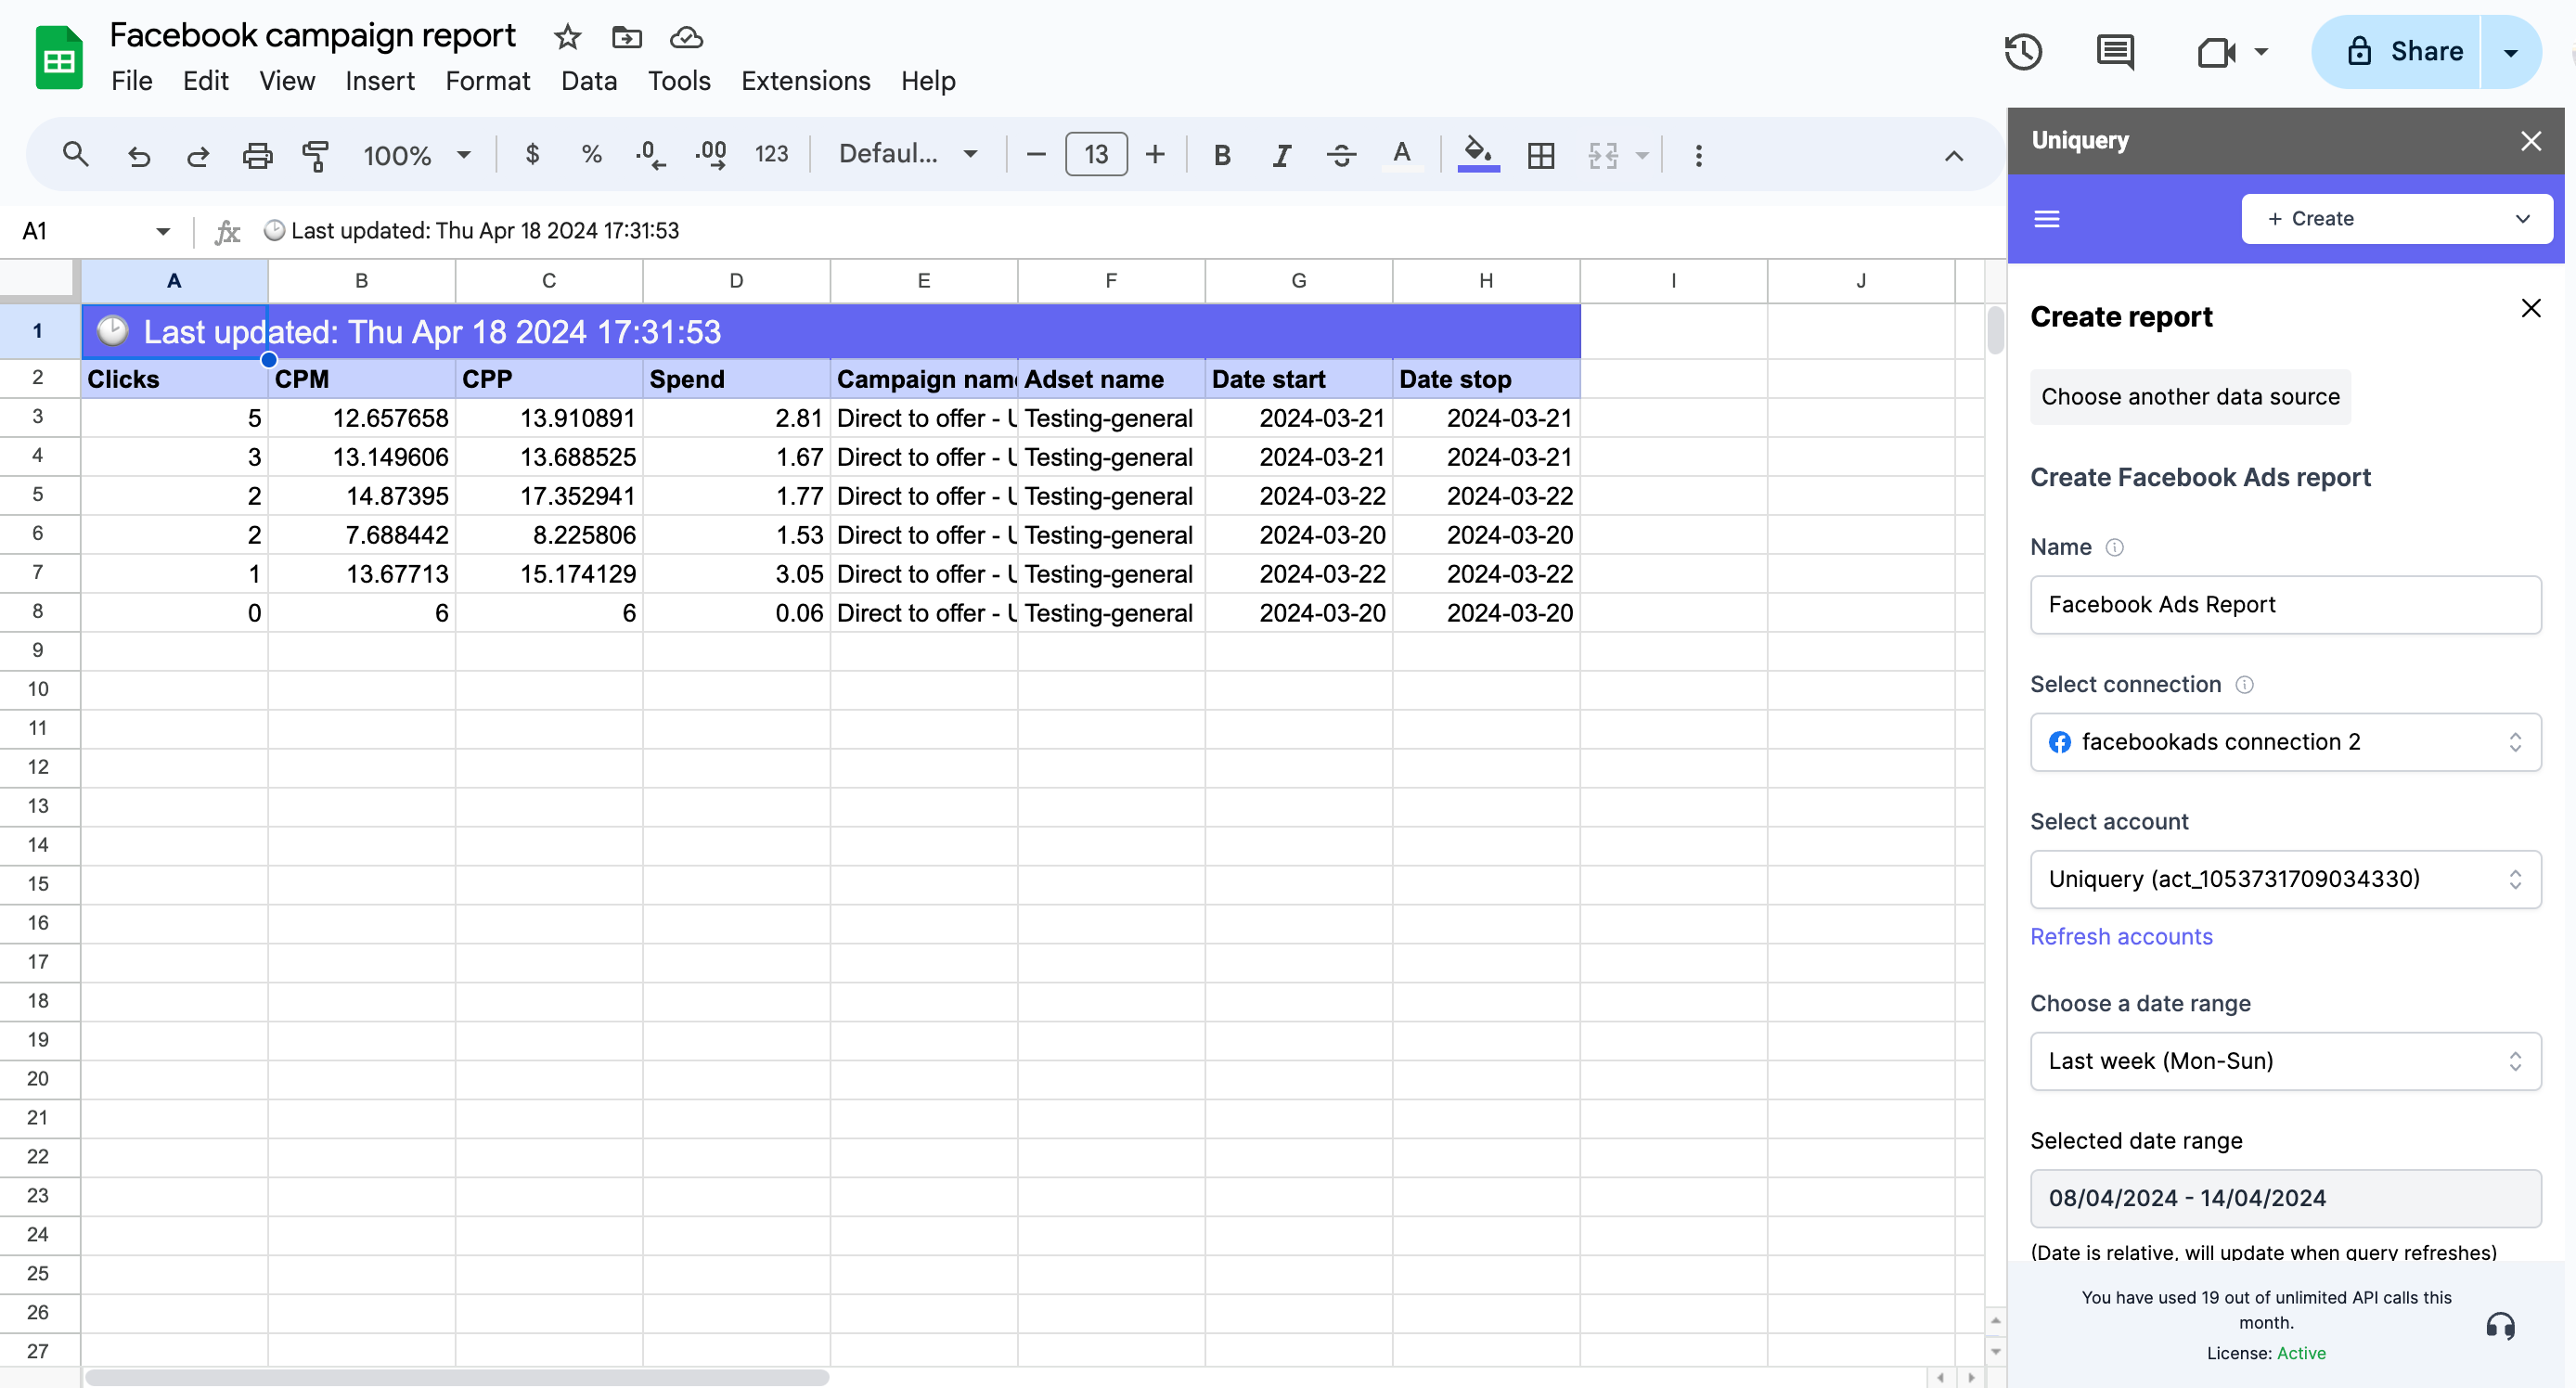
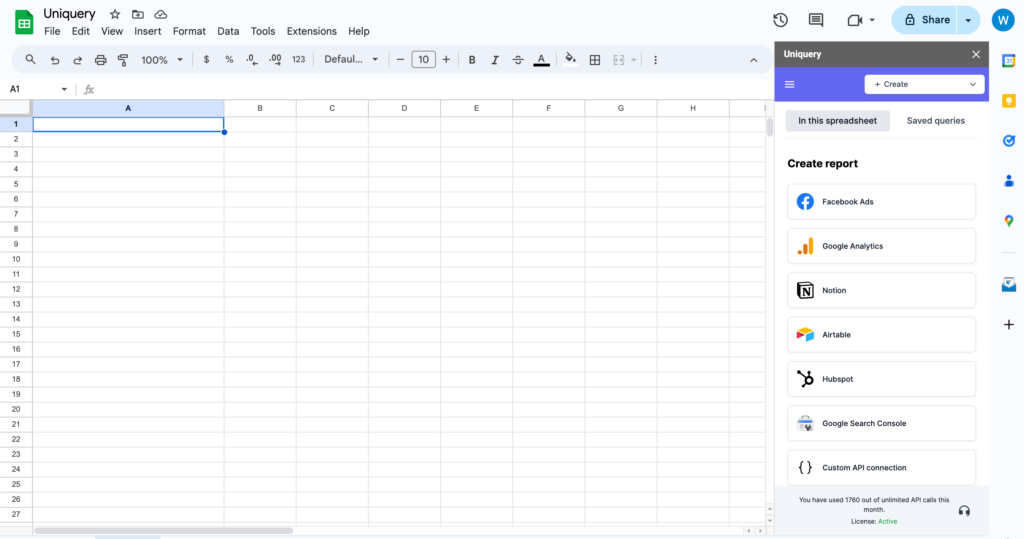
On the top Create menu, select “Create report”, and on the next page, select Facebook Ads. Now you can see the Facebook Ads report configuration page.
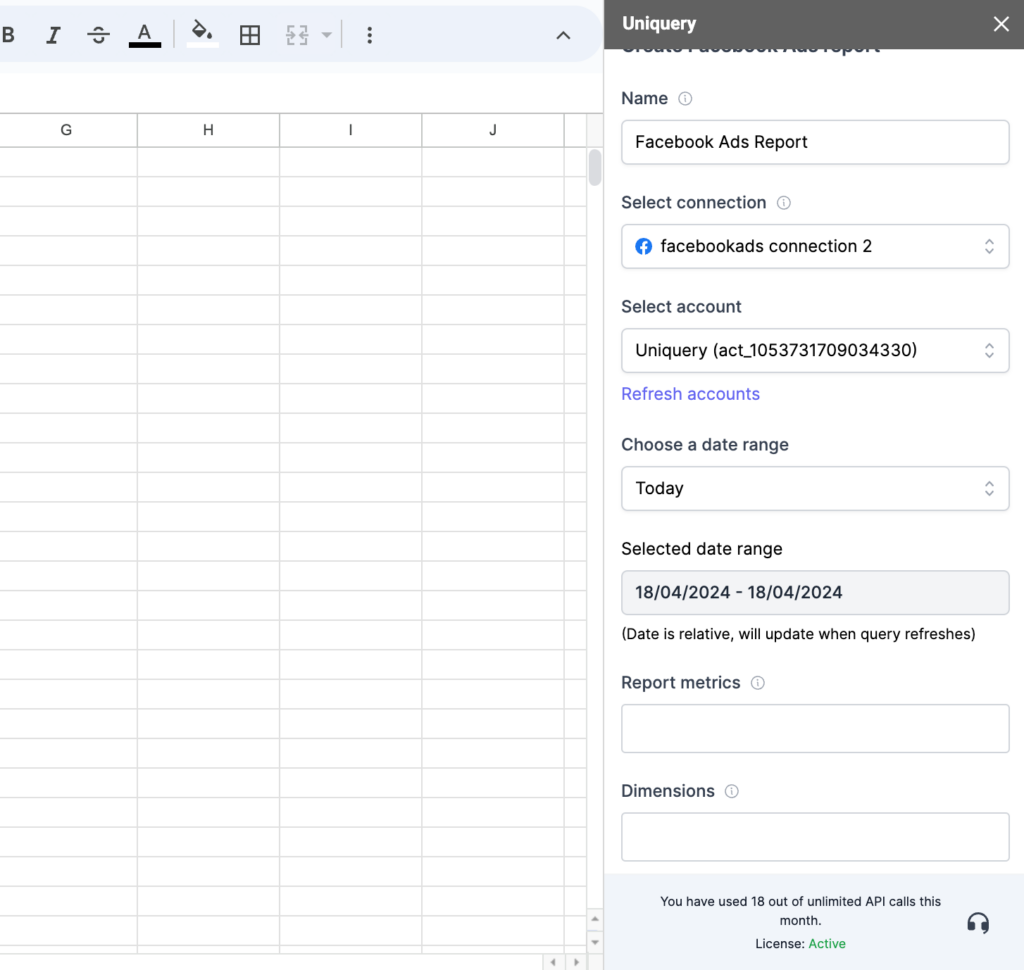
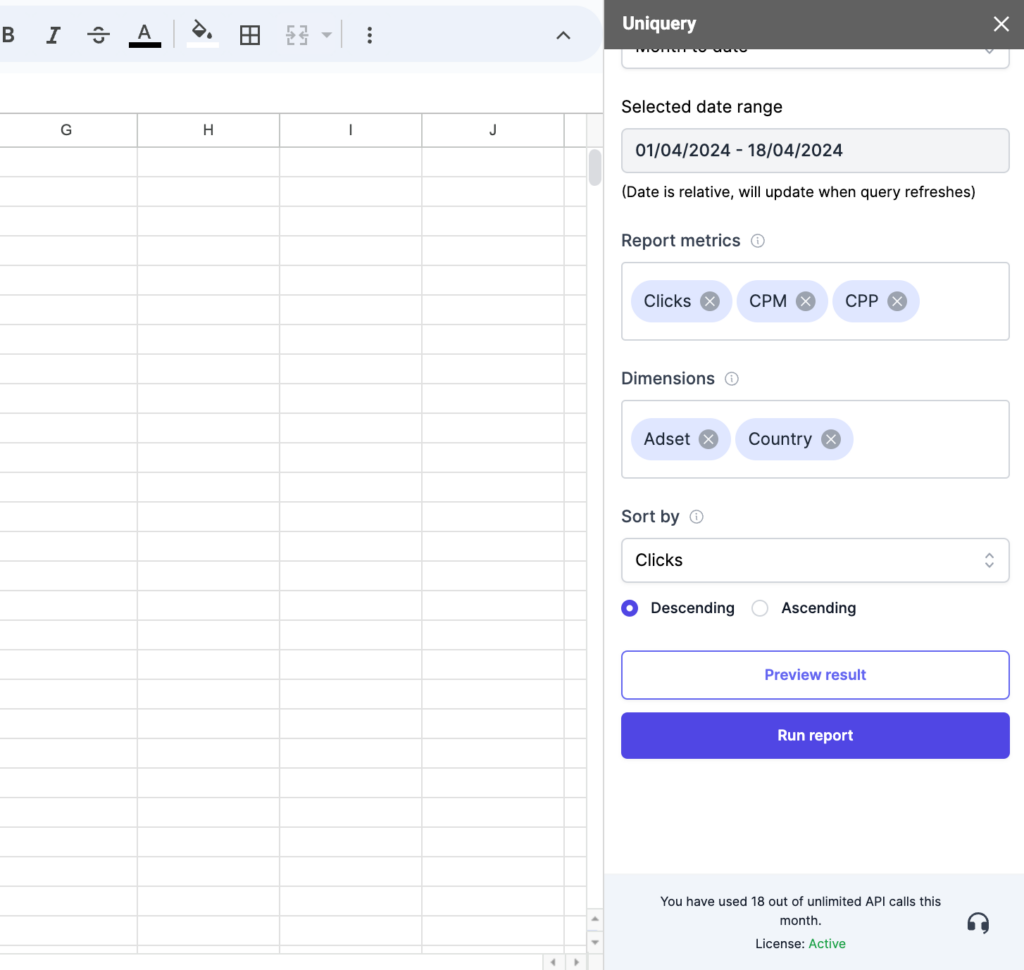
The first step of creating a Facebook Ads report is to select a date range for the report. In this example, we will select the date range of “Month to date,” meaning that the report will contain data from the first day of the current month to today.
Please remember whatever date you choose here will become relative. When the data refreshes in the next month, you will get the next month’s “Month to date” data.
The second step of creating a Facebook Ads report in Google Sheets involves selecting the reporting metrics and dimensions. This is important as it defines the type of data you’ll be analyzing and presenting in your report.
Metrics
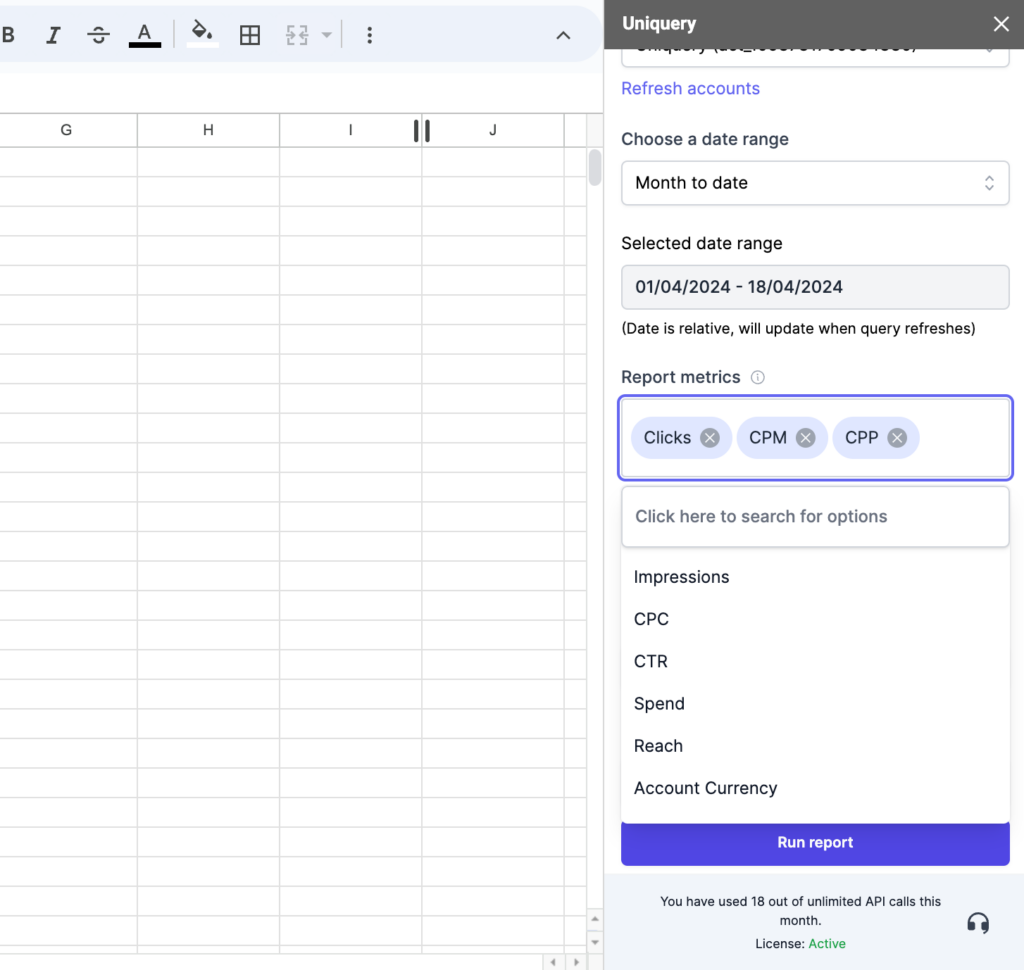
Metrics refer to the quantitative measurements of your Facebook Ads performance. These are numerical data points that tell you how your campaigns are performing in terms of achieving your marketing objectives. Examples of metrics you might consider including in your report are:
- Clicks: The total number of clicks on your ads. It’s a direct indicator of how engaging your ads are.
- Impressions: The number of times your ads were on screen. This helps you understand the reach of your ads.
- Spend: The total amount of money spent on your ads during the selected date range. It’s crucial for tracking your advertising budget.
- Conversions: The number of times users took a desired action after clicking on your ad. This could range from making a purchase, signing up for a newsletter, or any other goal you’ve set.
- Cost per Action (CPA): The average cost for each action (conversion) taken. This metric helps you evaluate the cost-effectiveness of your ads.
Dimensions
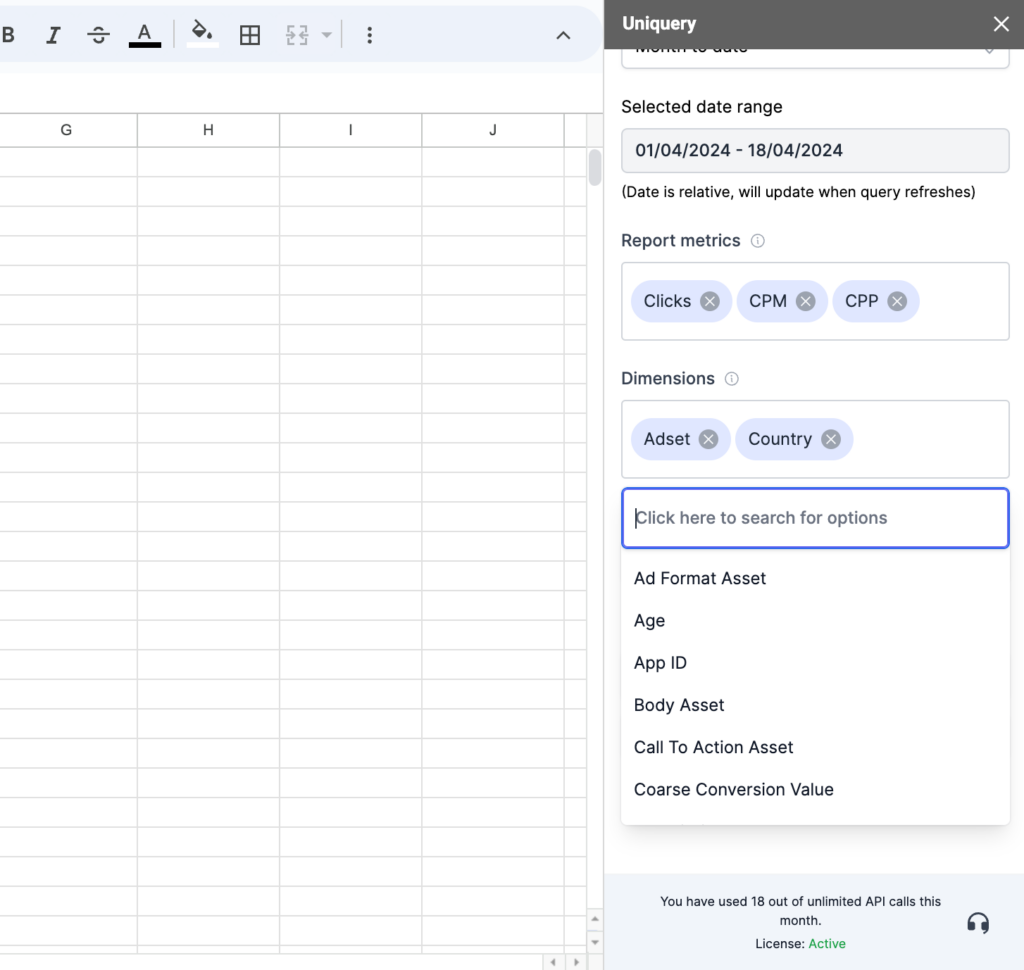
Dimensions, on the other hand, provide context to your metrics. They are the qualitative aspects of your data that help you segment and break down your metrics for deeper insights. Examples of dimensions to include in your Facebook Ads report might be:
- Campaign: Grouping metrics by campaign allows you to see which campaigns are performing best.
- Ad Set: Provides insights into which sets of ads within campaigns are driving performance.
- Ad: Breaks down performance to the individual ad level, showing which specific ads are most effective.
- Demographics: Including dimensions such as age, gender, or location, can help you understand who your ads are reaching and how different groups are responding.
By selecting a combination of metrics and dimensions, you can tailor your Facebook Ads report to provide a comprehensive analysis of your campaigns’ performance.
The key is to choose metrics and dimensions that align with your specific business goals and objectives, ensuring that the report you create in Google Sheets using Uniquery delivers actionable insights.
In the final step, you will be able to choose a metric that you want to sort the report by. You can choose a metric and sort the result by descending or ascending order.
Preview and run report
Once you have configured your Facebook Ads report, you can preview it before importing data into Google Sheets.
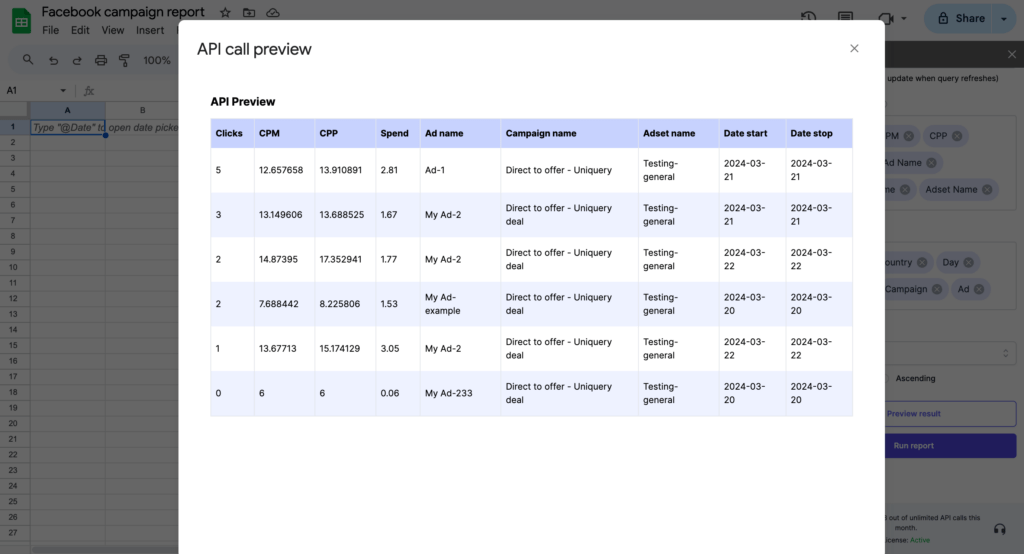
If the result doesn’t exactly look like the data you want, you can simply close the preview window and change configurations on the sidebar, and preview the result again, until you are happy with the data you get.
Once this is done, close the preview window and click “Run report”.
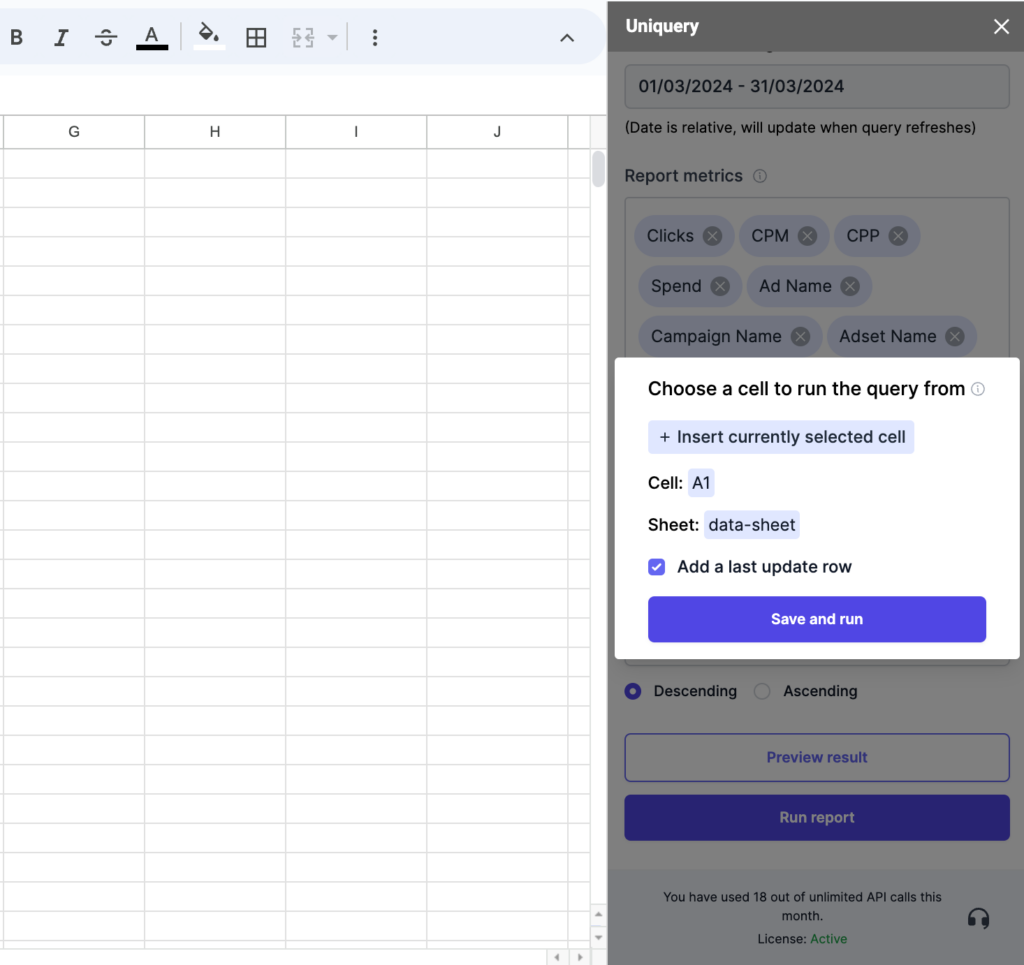
You will then be asked to choose a sheet(tab) and a cell to insert your data.
We recommend the following setup:
- Always use a standalone sheet(tab) for data imported.
- Always insert the data from the A1 cell of a blank sheet.
This setup will prevent your existing data from being overwritten by the imported data.
In this example, we created a sheet called “data-sheet” and chose the A1 cell in that sheet for the Facebook Ads data import.
Scheduling Automatic Refreshes
After creating the report in Google Sheets using Uniquery, you have the option to schedule the report for automatic refreshes. This feature ensures that your report always contains the most up-to-date data without requiring manual updates. You can set up the report to refresh on an hourly, daily, or weekly basis, depending on your needs and how frequently your data changes.
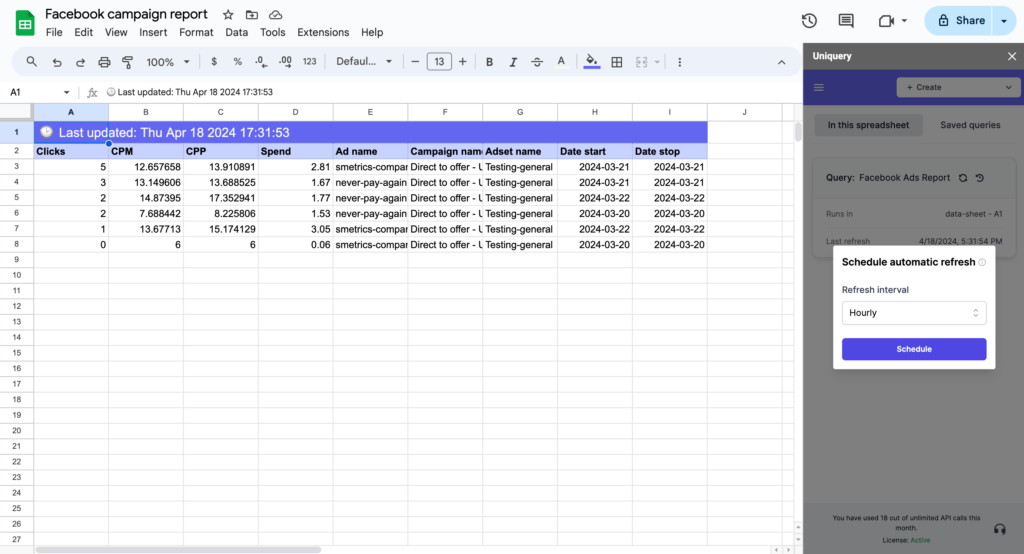
If your data requires constant monitoring, you may opt for hourly refreshes. For reports that track longer-term trends, daily or weekly refreshes might be more appropriate.
Once you have selected your preferred frequency, confirm your choice, and the system will automatically take care of the rest. Your report will refresh at the interval you’ve selected, ensuring that every time you access your report, you’re looking at the most current data available.
Remember to consider the volume of data being processed and the potential impact on performance when choosing your refresh frequency. In some cases, less frequent refreshes (such as daily or weekly) may be more suitable to avoid system overload, especially for reports that aggregate large amounts of data.
Conclusion
Integrating Facebook Ads data into Google Sheets has never been easier, thanks to Uniquery.
By following the steps outlined above, marketers can now efficiently analyze ad performance, gain impactful insights, and drive better decision-making.
Uniquery’s simplicity and accessibility make it an indispensable tool in the arsenal of digital marketers focused on data-driven strategies. With your Facebook Ads data seamlessly integrated into Google Sheets, the possibilities for sophisticated analysis and actionable insights are limitless.